God is our Guide  Number 1 site for helping reverse diseases
 

CIDPUSA.ORG

 
Home
Diagnosis
Treatment
Pathology
Women Heart Risk
IgG subclass deficiency 
Fibrmomyalgia
IVIG
Diet anti-inflammatory
Burning Feet Home
Services Page
Hepatitis
Autoimmune diseases

 Lupus page

Bible healing
Pemphagoid


   Hair rejuvination

   Alopecia general

How to reduce stress

Breast enlargement

Spinal cord

Lupus page

Coconut oil Benefits

Vitamins and cancer

Cancer ReganB-12 deficiency

Autoimmune autism

 Dementia and exercise

 Exercise and weight loss

  Sleep and stay fit

Bird Flu

Cancer killer cells

Oils for health

Green tea      

Women over 60

 Bees disappearance

 ALS patients improve

Skin Glow Guide

 Natural Makeup

endocrine disrupters

Thyroid health

poison at home

spinal pain

Hypoparathroidism

Mercury in makeup

    Toxic Lipstick


 "Landsat 5 satellite"

  alternatives treatment of autoimmune disease read our e-book 

Special GoogleHealth Search
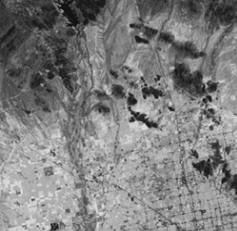
Landsat 5 image of Phoenix, Arizona D This is an image of Phoenix, Arizona showing the near infrared data collected by the Landsat 5 satellite. The light areas are areas with high reflectance of near infrared waves. The dark areas show little reflectance. What do you think the black grid lines in the lower right of this image represent?
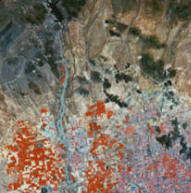
False-color image of Pheonix, Arizona D This image shows the infrared data (appearing as red) composited with visible light data at the blue and green wavelengths. If near infrared is reflected off of healthy vegetation, what do you think the red square shaped areas are in the lower left of the image?

Instruments on board satellites can also take pictures of things in space. The image below of the center region of our galaxy was taken by IRAS. The hazy, horizontal S-shaped feature that crosses the image is faint heat emitted by dust in the plane of the Solar System.


IRAS image of the MilkywayD
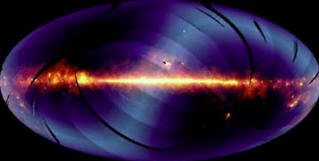
Infrared Processing and Analysis Center, Caltech/JPL