Magnetic fileds world map
CIDPUSA.ORG autoimmune diseases
Magnetic Field Deficiency Syndrome and Magnetic Treatment
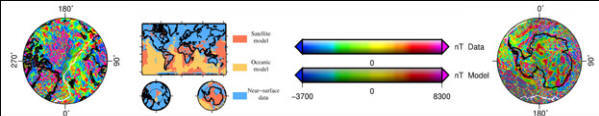
The World Digital Magnetic Anomaly Map (WDMAM) shows the variation in strength of the magnetic field after the Earth's dipole field has been removed. Earth's dipole field is generated by circulating electric currents in the planet's metal core. It varies from 35,000 nanoTesla (nT) at the Equator to 70,000 nT at the poles.
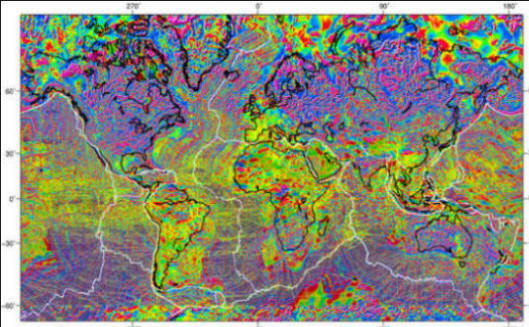
Image: Korhonen, J.V., Fairhead, J.D., Hamoudi, M., Hemant, K., Lesur, V., Mandea, M., Maus, S., Purucker, M., Ravat, D., Sazonova, T.,and Thebault, E., 2007, Magnetic Anomaly Map of the World (and associated DVD), Scale: 1:50,000,000, 1st edition, Commission for the Geological Map of the World, Paris, France.
After removal of the dipole field anomalies, the variations in the field (few hundreds of nT) are due to changes in the magnetic properties of the crustal rocks themselves.
Hot colours (reds) indicate high values; cold colours (blues) indicate low or negative values of the magnetic field strength.
Magnetic Field
Magnetic Flux
Magnetic stimulator